SNfactory Discovery and Follow-up Simulations
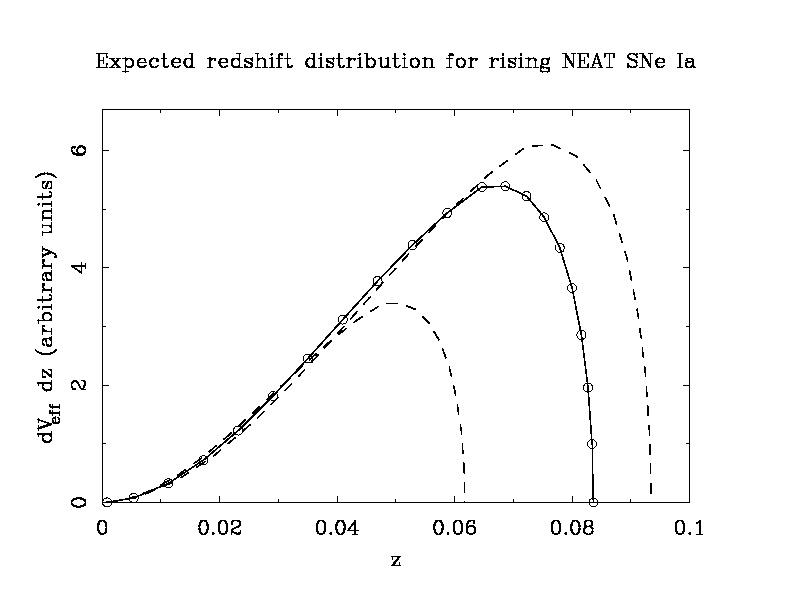 Here is shown the redshift distribution for Type Ia supernovae the
SNfactory expects to find using the NEAT dataset. A
limiting magnitude of B = 18.7 has been assumed. The central, solid
curve corresponds to a "typical" Type Ia with stretch = 1. The other
two curves correspond to the redshift distributions for the most
overluminous and most unluminous Type Ia supernova. This redshift
distribution results from an interplay between the increasing volume
element at larger redshifts and the shortened time during which a rising
supernova is above the detection threshold. The cut-off redshift
corresponds to a Type Ia supernova at peak.
Here is shown the redshift distribution for Type Ia supernovae the
SNfactory expects to find using the NEAT dataset. A
limiting magnitude of B = 18.7 has been assumed. The central, solid
curve corresponds to a "typical" Type Ia with stretch = 1. The other
two curves correspond to the redshift distributions for the most
overluminous and most unluminous Type Ia supernova. This redshift
distribution results from an interplay between the increasing volume
element at larger redshifts and the shortened time during which a rising
supernova is above the detection threshold. The cut-off redshift
corresponds to a Type Ia supernova at peak.
Greg Aldering (galdering@lbl.gov)
last updated June 23, 2000